

![]()
![]()
![]()
![]()
![]()
![]()
![]()
![]()
![]()
![]()
![]()
 .
.
Fluoride
Volume 23, No. 2; April, 1990; pp 55-67
by John A. Yiamouyiannis, Ph.D.
| SUMMARY: Data from dental examinations of 39,207 schoolchildren, aged 5-17, in 84 areas throughout the United States are analyzed. Of these areas, 27 had been fluoridated for 17 years or more (F), 30 had never been fluoridated (NF), and 27 had been only partially fluoridated or fluoridated for less than 17 years (PF). No statistically significant differences were found in the decay rates of permanent teeth or the percentages of decay-free children in the F, NF, and PF areas. However, among 5-year olds, the decay rates of deciduous teeth were significantly lower in F than in NF areas. |
KEY WORDS: Dental caries; Fluoridation; Schoolchildren; Tooth decay.
Introduction
It has become widely accepted among dental and public health professionals that fluoridation reduces tooth decay by one-half to two-thirds (1,2). However, recent studies by public health dentists in New Zealand, Canada, and the United States have reported similar or lower tooth decay rates in nonfluoridated areas as compared to fluoridated areas (3-6). Moreover, findings in the United States and worldwide show that, over the last 25 years, reductions in tooth decay rates in nonfluoridated areas are comparable to those in fluoridated areas (7-9).
From 1986 to 1987, dentists trained by the US National Institute of Dental Research (NIDR) performed dental examinations on 39,207 schoolchildren, aged 5-17, in 84 areas throughout the United States. This survey allowed a comparison of tooth decay of large numbers of people from a large number of areas, some of which have been fluoridated and some of which have not.
Materials and Methods
Through the United States Freedom of Information Act, we obtained a printout of the dental records and a list of the 84 areas used in this survey. From these data, we calculated the number of decayed and filled deciduous teeth (dft) and the number of decayed, missing, and filled permanent teeth (DMFT) for each record and entered the resulting data into a computer. All calculations were triple-checked before being entered into the computer and all computer entries were double-checked.
By computer, each record (including the dft and DMFT scores of each student) was placed in the appropriate age group. For each of the 13 age groups, average dft and DMFT rates per child were determined for each of the 84 areas. Age-adjusted DMFT rates for 5- to 17-year olds were calculated by adding the DMFT rates for each of the 13 age groups and dividing by 13 (10).
We obtained the data regarding the fluoridation status of the areas surveyed from Natural Fluoride Content of Community Water Supplies, Fluoridation Census 1969, Fluoridation Census 1975, and Fluoridation Census 1985, all published by the US Public Health Service. In some cases, local authorities were also contacted to determine the fluoridation status of an area.
Average DMFT (and dft) rates for F, NF, and PF groups were calculated for each age. Average-age-adjusted DMFT (and dft) rates for the F, NF, and PF groups were calculated by taking the average of age-adjusted rates for the respective groups (10).
The percentage of "caries-free" children was calculated for each age group for each area. Age-adjusted "caries-free" rates were also calculated. A student was considered to be "caries-free" so long as they had no DMFT or dft. For example, a child who had lost all their teeth and no longer had any left to be decayed or filled would not be recorded as a "caries-free" student.
Through the United States Freedom of Information Act, we also obtained residence data for each of the above schoolchildren which allowed us to calculate tooth decay rates for those in F, NF, and PF areas who had lived at the same residence for their entire life.
The two-tailed t-test was used to determine 95% confidence intervals and to determine statistical significance (at the 95% confidence level). A two-sided Wilcoxon rank sum test (11) was used to determine whether there was a statistically significant difference (at the 95% confidence level) in the rank order of DMFT rates of F and NF areas.
Results
Table 1 presents the number of students examined and the age-adjusted DMFT rate for each of the 84 areas in the order of increasing tooth decay rate. There is no statistically significant difference in the rank order of the age-adjusted DMFT rates of F and NF areas. As can be seen by examination of column 1, there is no clustering of fluoridated areas at the top of the table. In the quartile with the lowest age-adjusted DMFT rates, 9 are non-fluoridated, 3 are partially fluoridated, and 9 are fluoridated. In the quartile with the highest DMFT rates, 5 are nonfluoridated, 10 are partially fluoridated, and 6 are fluoridated. Table 1 also indicates that there is no biased geographical distribution of F and NF areas that is hiding some potential decay preventive effect of water fluoridation.
|
Table 1 |
|||||
| Water | Area | No. | DMFT | dft | Caries-free |
| NF | Buhler, KS | 543 | 1.229 | 0.810 | 44.7% |
| F | El Paso, TX | 451 | 1.321 | 0.777 | 43.5% |
| NF | Brooklyn, CT | 410 | 1.420 | 0.693 | 47.6% |
| F | Richmond, VA | 475 | 1.435 | 0.715 | 45.6% |
| F | Ft. Scott, KS | 491 | 1.442 | 0.774 | 38.2% |
| F | Prince George, MD | 443 | 1.491 | 0.539 | 48.0% |
| NF | Cloverdale, OR | 354 | 1.494 | 0.872 | 40.4% |
| PF(71) | Alliance, OH | 467 | 1.584 | 0.549 | 44.6% |
| NF | Martin, Co., FL | 440 | 1.587 | 0.677 | 41.0% |
| F | Andrews, TX | 455 | 1.588 | 0.893 | 35.8% |
| NF | Coldspring, TX | 406 | 1.589 | 1.144 | 33.8% |
| F | Tulsa, OK | 504 | 1.602 | 1.075 | 35.5% |
| NF | Palm Beach, FL | 476 | 1.613 | 0.896 | 34.5% |
| PF | Hocomb, MO | 558 | 1.628 | 0.883 | 40.3% |
| NF | Kitsap, WA | 564 | 1.635 | 0.769 | 42.9% |
| F | St. Louis, MO | 491 | 1.638 | 0.711 | 39.1% |
| PF (82) | Houston, TX | 488 | 1.662 | 0.819 | 41.8% |
| F | Clarksville, IN | 428 | 1.678 | 0.747 | 40.4% |
| NF | Grand Island, NE | 535 | 1.719 | 0.789 | 40.7% |
| F | Ft. Stockton, TX | 415 | 1.722 | 0.891 | 33.4% |
| NF | San Antonio, TX | 422 | 1.736 | 0.895 | 39.3% |
| F | Cherry Creek, CO | 441 | 1.757 | 0.727 | 36.5% |
| F | Tuscaloosa, AL | 475 | 1.809 | 0.963 | 32.0% |
| PF | Marlon Co., FL | 545 | 1.817 | 0.944 | 28.8% |
| F | Cleveland, OH | 486 | 1.819 | 0.715 | 39.9% |
| NF | Allegany, MD | 458 | 1.834 | 0.735 | 38.3% |
| PF (78) | Norwood, MA | 434 | 1.841 | 0.640 | 39.9% |
| F | Alton, IL | 511 | 1.859 | 0.843 | 37.6% |
| NF | Shamokin, PA | 462 | 1.861 | 1.023 | 32.2% |
| NF | Lodi, CA | 573 | 1.878 | 1.197 | 33.0% |
| PF | Bullock Creek, MI | 472 | 1.879 | 0.766 | 36.7% |
| PF (82) | Marlboro, MA | 386 | 1.885 | 0.613 | 40.8% |
| PF (81) | Allen, TX | 445 | 1.905 | 0.674 | 38.7% |
| F | San Francisco, CA | 456 | 1.908 | 1.031 | 36.3% |
| NF | E. Orange, NJ | 401 | 1.909 | 0.796 | 38.0% |
| PF (71/60) | Lincoln/Sudbury, MA | 436 | 1.923 | 0.758 | 37.8% |
| NF | Conejo, CA | 620 | 1.930 | 0.811 | 41.7% |
| NF | Lakewood, NJ | 450 | 1.933 | 0.698 | 38.0% |
| F | New York City-2 | 336 | 1.953 | 0.812 | 34.9% |
| PF | Bethel, WA | 540 | 1.958 | 1.072 | 34.3% |
| F | Beach Park, IL | 518 | 1.970 | 0.878 | 35.2% |
| PF | Rising Star, TX | 370 | 1.971 | 0.909 | 28.7% |
| F | Philipsburg, PA | 499 | 1.983 | 0.982 | 33.2% |
| F | Lanett, AL | 503 | 1.994 | 0.978 | 31.9% |
| PF (82) | Plainville, CT | 436 | 2.006 | 0.795 | 39.3% |
| NF | Wichita, KS | 496 | 2.036 | 0.878 | 33.5% |
| NF | Newark, NJ | 494 | 2.038 | 0.869 | 35.9% |
| PF | Knox Co., TN | 530 | 2.056 | 1.152 | 31.3% |
| NF | Los Angeles, CA | 540 | 2.063 | 1.039 | 33.0% |
| F | Pittsburgh, PA | 415 | 2.064 | 0.781 | 34.1% |
| PF (70) | Lincoln, NE | 476 | 2.076 | 0.825 | 31.5% |
| NF | Newton, KS | 464 | 2.083 | 1.225 | 31.1% |
| PF | Lakeshore, MI | 486 | 2.088 | 0.781 | 32.6% |
| NF | New Paltz, NY | 350 | 2.110 | 0.751 | 34.8% |
| F | Bemidgl, MN | 485 | 2.124 | 1.001 | 29.3% |
| NF | Alpine, OR | 397 | 2.133 | 0.974 | 34.7% |
| NF | Canon City, CO | 463 | 2.160 | 1.118 | 33.1% |
| NF | Wyandank, NY | 396 | 2.161 | 0.828 | 34.7% |
| NF | Milbrook, NY | 332 | 2.179 | 0.716 | 32.2% |
| NF | Chowchilla, CA | 551 | 2.181 | 1.073 | 33.0% |
| F | New York City-1 | 503 | 2.190 | 0.627 | 37.9% |
| PF (82) | Baltic, SD | 487 | 2.193 | 0.974 | 27.8% |
| PF (71/74) | Blue Hill, NE | 480 | 2.218 | 0.855 | 29.6% |
| NF | Crawford, PA | 492 | 2.222 | 0.996 | 28.5% |
| PF (74) | New Orleans, LA | 459 | 2.251 | 0.953 | 27.4% |
| PF (70) | Memphis, TN | 464 | 2.253 | 0.763 | 33.1% |
| PF | Madison Co., MS | 493 | 2.259 | 1.455 | 26.4% |
| F | Milwaukee, WI | 478 | 2.349 | 0.909 | 32.1% |
| NF | Tooele, UT | 519 | 2.372 | 1.458 | 24.3% |
| NF | Chicopee, MA | 453 | 2.389 | 0.862 | 34.2% |
| PF | Cambria, PA | 532 | 2.460 | 1.039 | 27.1% |
| PF (75) | Springfield, VT | 444 | 2.489 | 0.838 | 32.1% |
| F | Dearborne, MI | 491 | 2.496 | 1.167 | 26.3% |
| F | Maryville, TN | 466 | 2.512 | 1.287 | 22.9% |
| PF (81) | Taunton, MA | 445 | 2.515 | 0.903 | 31.0% |
| F | Greenville, MI | 556 | 2.558 | 1.191 | 25.3% |
| PF | Hart/Pentwater, MI | 455 | 2.584 | 1.344 | 24.1% |
| F | Philadelphia, PA | 463 | 2.649 | 0.824 | 26.0% |
| PF | Sup. Union #47, VT | 487 | 2.710 | 0.907 | 28.1% |
| NF | Cutler/Oroal, CA | 528 | 2.796 | 1.742 | 19.2% |
| F | Brown City, MI | 512 | 2.972 | 1.229 | 22.5% |
| PF (83) | Lawrence, MA | 339 | 3.012 | 1.262 | 17.6% |
| NF | State of Hawaii | 293 | 3.294 | 1.375 | 23.9% |
| PF | Concordia, Co., LA | 424 | 3.767 | 1.508 | 12.4% |
There is no statistically significant difference between the average DMFT rates for the F and NF groups at any age (Figure 1). The average DMFT rates of the PF groups are higher than those of the F and NF groups at every age with the exception of 14-year olds.
There is no statistically significant difference in the average-age-adjusted DMFT rates among the F, PF, and NF groups (Table 2). The average-age-adjusted DMFT rates in F and NF areas are 1.96 and 1.99, respectively. The 95% confidence interval for the DMFT rate in F areas minus the DMFT rate in NF areas is (-0.19, 0.25); thus we can rule out, with a certainty of 95%, the possibility that the DMFT rate in F areas is more than one-fourth of a tooth less than in the NF areas. We can also rule out, with a certainty of 95%, the possibility that the DMFT rate in NF areas is more than one-fifth of a tooth less than in the F areas.
|
Table 2
Average-age adjusted DMFT rates for 39,207 U.S. schoolchildren and 17,336 life-long resident schoolchildren in 84 areas throughout the United States. Standard deviations are given in parentheses. |
|||||
|
Total
|
Life-long
|
||||
|
No. of Areas
|
No. of Students
|
DMFT
|
No. of Students
|
DMFT
|
|
| Fluoridated |
27
|
12,747
|
1.96 (0.415)
|
6,272
|
1.97 (0.465)
|
| Partially Fluoridated |
27
|
12,578
|
2.18 (0.465)
|
5,642
|
2.25 (0.470)
|
| Nonfluoridated |
30
|
13,882
|
1.99 (0.408)
|
5,422
|
2.05 (0.517)
|
To make certain that the absence of a statistically significant difference
between the DMFT rates of schoolchildren living in F and NF areas was not
the result of the mobility of schoolchildren, or their sex and racial compositions,
DMFT rates were determined for 1.] those who spent their entire lives
in one household and 2.] for white males and white females. The results
in Table 2 show that for life-long residents, there is no statistically
significant difference in average-age-adjusted DMFT rates in F and NF areas.
In addition, there are no statistically significant differences in tooth
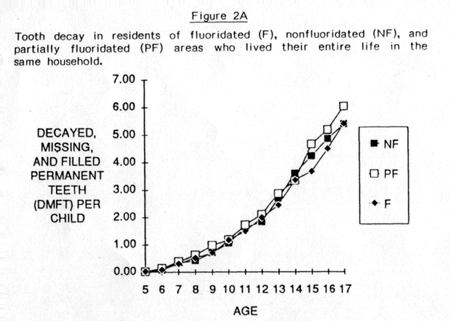
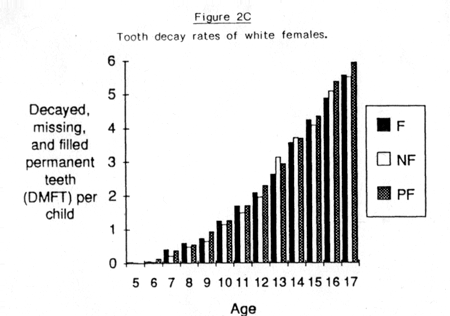
decay rates between permanent residents of F and NF areas at any age (Figure
2A). If water fluoridation were to have reduced tooth decay as measured
by DMFT, tooth decay rates for lifelong residents living in fluoridated
areas should be lower than residents who had not spent their entire lives
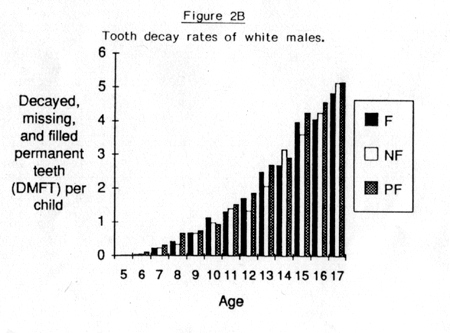
in these areas. This was not found to be the case. Figures 2B and 2C show
that among white males and white females (which make up about 70% of all
the children studied), there is no significant difference in DMFT rates
in the F and NF areas at any age group.
|
Figure 2C |
|
|
Figure 3
 (Click to enlarge image)
 |
Figure 4
 (Click
to enlarge image) (Click
to enlarge image) |

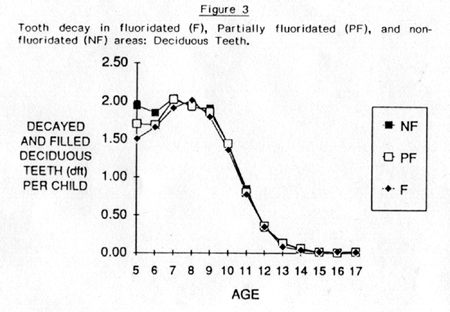
In contrast, notably lower tooth decay rates were observed in the deciduous teeth of young children living in F areas. The 5-, 6-, and 7-year-olds in the F group have dft rates 22%, 9% and 6% lower than those of the NF group, respectively (Figure 3). Although the average-age adjusted dft rates for F, NF, and PF groups were not significantly different statistically, they were higher for the NF groups (0.96, +0.25) for the PF groups (0.93, +0.24), which in turn is slightly higher than the F group (0.89, +0.19).
To focus in on dft rates among children 5-8, the eight areas which commenced water fluoridation between 1970 and 1978 were removed from the PF group and added to the F group. The 5-, 6-, and 7-year-olds in the new F (F*) group have dft rates 24%, 10%, and 10% lower than those of the NF group, respectively, and the dft rate of 5-year-olds in the F* group is significantly lower (p < 0.05) than that of the NF group.
Moreover, among 5-, 6-, and 7-year-old lifelong residents in the F* group, dft rates were 42%, 18% and 11% lower than those of the NF group, respectively, and the dft rate of 5-year-olds in the F* group was significantly lower (p < 0.002) than that of the NF group (Table 3). If water fluoridation were to have reduced tooth decay as measured by dft among 5-year-olds, tooth decay rates for lifelong 5-year-old residents living in fluoridated areas should hav been lower than those of residents who had not spent their entire lives in these areas. This was found to be the case. From Table 3, it can also be seen that this large and significant reduction disappears after a couple of years.
|
Table 3
Percentage change in dft rates in all residents and life-long residents of F and F* areas in comparison to NF areas. |
||||
| Total | Life-long | |||
| Age | (NF-F)/NF | (NF-F*)/NF | (NF-F)/NF | (NF-F*)/NF |
| 5 | 22% | 24% (p < 0.05) | 36% (p < 0.02) | 42% (p < 0.002) |
| 6 | 9% | 10% | 14% | 18% |
| 7 | 6% | 10% | 5% | 11% |
| 8 | -4% | 1% | -5% | 1% |
Fluoride may have caused a reduction in dft by delaying deciduous tooth eruption. This is consistent with the fact that the dft rate in the F and F* groups reaches a maximum later than in the NF group. Fluoride-induced delays in tooth eruption have been reviewed elsewhere (12, 13) with contradictory conclusions, but more recent studies examining 5-year-olds have indicated delayed eruption that could account for such a difference in tooth decay rates (14).
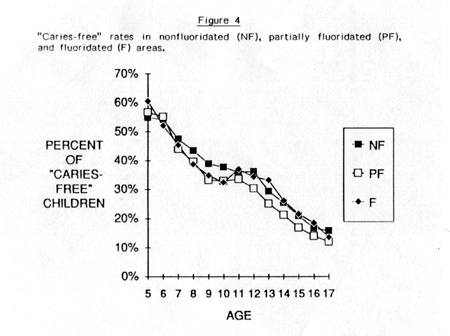
The percentage of decay-free children in F, PF, and NF areas is 34.5%, 31.9%, and 35.1% respectively. There is no statistically significant difference between the average "caries-free" rates for the F and NF groups at any age (Figure 4).
Discussion
The data presented here are consistent with data reported elsewhere in large US surveys. In 1977, the Rand Corporation examined the tooth decay rate of 25,000 children in (5F and 5NF) nonrandomly selected areas (15). In the three areas in their study that were included in the present study, we compared the tooth decay rates of 12-year-olds. There was good agreement between this study and theirs with regard to tooth decay rate, after converting DMFS (decayed, missing and filled permanent tooth surfaces) to DMFT (16) and considering the acknowledged 36% decrease in DMFS from 1979-1980 to 1986-1987 (17).
In 1983-84, Hildebolt et al. (4) examined the tooth decay rates of over 6500 Missouri rural schoolchildren from grades 2 (average age 7.5) and 6 (average age 11.5). Among 6th graders living in the most intensively studied regions, the average DMFT + dft rate was 2.07 for those drinking nonfluoridated water and 2.17 for those drinking fluoridated water, compared to the DMFT + dft rate of 2.00 reported for 11-year-olds living in Holcomb, Missouri in our study.
In 1986, Kumar et al. examined 1446 schoolchildren aged 7-14 from Newburgh, New York (fluoridated in 1945) and cohorts from nonfluoridated Kingston, New York (18). The sample selection was nonrandom and had a response rate of only 50-65%. Nonetheless, the age-adjusted DMFT rates observed (1.5 for fluoridated Newburgh and 2.0 for nonfluoridated Kingston) were in line with the corresponding values obtained in this study for communities in the area (1.5 for nonfluoridated New Paltz, New York and 1.7 for fluoridated New York City).
Conclusions
Does water fluoridation reduce tooth decay? i] This study and other recent studies (3-8) show that there is currently no significant difference in tooth decay rates in F and NF areas and that decreases in tooth decay rates over the last 25 years have been comparable regardless of fluoridation status; if this is true, there was no significant difference in the tooth decay rates between these areas 25 years ago. ii] From 1970 to the present, total fluoride intake studies indicate an average intake of 1-2 mg per day in nonfluoridated areas and 3-5 mg per day in fluoridated areas (19,20); thus, it is difficult to claim that the reason tooth decay differentials between fluoridated and nonfluoridated areas have disappeared is because the fluoride intakes in these areas are now similar. Furthermore, the substantially higher incidence of dental fluorosis in fluoridated areas confirms that residents in these areas are consuming substantially higher levels of fluoride than those living in non-fluoridated areas (21-23). iii] Dramatic reductions in tooth decay have occurred in developing countries where there is no water fluoridation (see World Health Organization data) and there is little reason to suspect that there would be elevated levels of fluoride in the food chain (7,9,24,25). iv] In addition to recent studies, a number of early studies have also shown no significant reduction in tooth decay as a result of water fluoridation (7, 26-28). v] Serious questions have been raised regarding the reliability of earlier studies claiming that fluoridation causes a reduction in tooth decay (29).
Acknowledgments
I thank Kimberly Close-Hittle, Jerry Putnam, Margot Yiamouyiannis, and Opal Kuhn for their help in the calculation and verification of summary data as well as Jill Pitts and Chris Hiatt for their lightning fast speed in entering data into our computer. Without the generosity of Dr. Leo Roy, Dr. Reuben Benner, Dr. H. Charles Kaplan, Dr. Gerald Judd, Richard Barmakian, John C. Justice, Len Greenall, Mr. and Mrs. Andrew Yimoyines, Wini Silko, AIM International, Inc., and other patrons of the Center for Health Action and the Safe Water Foundation, the preparation and publication of this article would not have been possible. Finally, I thank Ray Fahey for correcting an error we had made in assigning the fluoridation status of E. Orange, NJ.
Addendum
Recently Brunelle (30), using the same database that we used, reported 26% fewer dfs (decayed and filled deciduous tooth surfaces) in children who had always resided in F communities than those who never lived in F communities. This finding agrees reasonably well with the data outlined in our Table 3, which shows a statistically significantly lower dft rate in lifelong 5-year-old residents of fluoridated areas. However, by omission of age-specific data, the Brunelle study covers up the fact that this difference in tooth decay is no longer significant in 6-year-olds and disappears entirely among 8-year-olds.
Another recent study by Brunelle and Carlos (31), which also uses the same database that we used, reports a 17% lower DMFS rate in the F areas. This study has a number of major deficiencies which render the study of little or no value.
1. It contains extremely serious errors. For example, by a cursory inspection, we found two values that are off by 100% or more. In their Table 9, the DMFS figure for lifelong F exposure residents of Region VII should be about 3, not 1.46 as reported. From their Table 3, the percent of 5-year-olds who have caries is 1.0%, not the 2.7% that can be calculated from the Table (100%-97.3%). When I pointed out this error to Dr. Carlos, he admitted that only 19 out of the 1851 5-year-olds had caries: 19/1851 = 1%, but refused to make the correction (32).
2. It fails to report the tooth decay rates for each of the 84 geographical areas surveyed. This covers up the fact that there is no difference in the tooth decay rates of the fluoridated and nonfluoridated areas surveyed. The Brunelle/Carlos study even fails to list the area studied. As a result, they produce misleading illustrations; for example, their Figure 3 implies that Arizona and New Mexico have the lowest tooth decay rates, when, in fact, not a single area was surveyed in either of the two states.
3. It fails to control for geographical differences in tooth decay rates by indiscriminately and disproportionately bunching children from all parts of the country into 2 groups, F and NF.
4. It fails to do the statistical analysis (or even provide the data, i.e. the standard deviation and sample number) necessary to determine whether the values found for F and NF areas are significantly different. Our calculations show that even if their data were accurate, the 17.7% figure does not reflect a statistically significant difference between the F and NF groups.
5. It fails to report the data for approximately 23,000 schoolchildren who were not life-time residents of either the F or NF areas (the PF group). If fluoridation reduced tooth decay, the DMFS rate of the PF group should have been greater than that of the F group and less than that of the NF group. Our data indicate that the PF group would have had a DMFS rate higher (although not significantly higher) than either the F or NF groups.
6. It fails to report the data for the percentages of decay-free children in F and NF areas. Our data indicate that had these calculations been done by Brunelle and Carlos, the results may have actually indicated better (although not significantly better) dental health in the NF areas.
Brunelle and Carlos, as well as their employer, the NIDR, have recently come under attack for presenting erroneous data and designing poor experiments which promoted the fluoride mouthrinse program (33). The apparent poor quality of their research regarding the 1986-87 survey (30, 31) is not an isolated case.
Read the Chemical and Engineering News (1989) article "New Studies Cast Doubt on Fluoridation Benefits" which discusses this study.
References and Notes
1. Green, J.C., Louie, R. and Wycoff, S.J.: Preventive Dentistry I. Dental Caries. J. Amer. Med. Assn., 262:3456-3463, 1989.
2. Szpunar, S.M. and Burt, B.A.: Dental Caries, Fluorosis and Fluoride Exposure in Michigan Schoolchildren. J. Dent. Res., 67:802, 1988.
3. Colquhoun, J.: Influence of Social Class and Fluoridation on Child Dental Health. Community Dent. Oral Epidemiol., 13:37-41, 1985.
4. Colquhoun, J.: Child Dental Health Differences in New Zealand. Community Health Studies, 11:85-90, 1987.
5. Gray, A.S.: Fluoridation: Time for a New Baseline? J. Canadian Dent. Assoc., 53:763-765, 1987.
6. Hildebolt, C.F., Elvin-Lewis, M., Molnar, S., McKee, J.K., Perkins, M.D. and Young, K.L.: Caries Prevalences Among Geochemical Regions of Missouri. Amer. J. Physical Anthropol., 78:79-92, 1989.
7. Diesendorf, M.: The Mystery of Declining Tooth Decay. Nature, 322:125-129, 1986.
8. Johnston, D.W., Grainger, R.M. and Ryan, R.K.: The Decline of Dental Caries in Ontario School Children. J. Canadian Dent. Assoc., 52:411-417, 1986.
9. Luoma, A-R. and Ronnberg, K.: Twelve-Year Follow-up of Caries Prevalence and Incidence in Children and Young Adults in Espoo, Finland. Community Dent. Oral Epidemiol., 15: 29-32, 1987.
10. Hill, A.B.: Medical Statistics. Hodder and Stoughton, London, 1977, p. 183. While the numerous age-specific comparisons of dental health of children at different ages provide the best evidence, it is occasionally desirable to have a summary rate to enable an overall comparison of different populations. For this purpose, we have used the age-standardized or age-adjusted rates, in order to avoid giving disproportionate weighting to larger numbers of children from one particular age-group that would tend to distort the summary figure. In using these rates, a standard population must be chosen. The one most commonly used is the hypothetical population with equal populations at each age group, which merely results from taking an arithmetic mean of the age-specific tooth decay rates measured. In the above reference, Austin Bradford Hill addresses this method in a discussion of the handling of mortality rates under a section titled "The Equivalent Average Death-Rate." Analogously, equal weights were given to each of the 84 geographical areas to prevent a distortion which might be induced by the variation of the area sample sizes, since certain geographical areas have characteristically higher (or lower) tooth decay rates than others.
11. Wilcoxon, F., Katti, S.K. and Wilcox, R.A.: Critical Values and Probability Levels for the Wisconsin Rank Sum Test and the Wilcoxon Signed Rank Test. Selected Tables in Mathematical Statistics, Markham Publishing Co., Chicago, 1:197, 201, 1970.
12. Waldbott, G.L., Burgstahler, A.W. and McKinney, H.L.: Fluoridation, the Great Dilemma. Coronado Press, Lawrence, Kansas, 1978, 423 pp.
13. El-Badrawy, H.E.: Dental Development in Optimal and Suboptimal Fluoride Communities. J. Canadian Dent. Assoc., 50:761-764, 1984.
14. Krylov, S.S. and Pemrolyd, K.: Deciduous Tooth Eruption and Fluorosis in the Case of Increased Fluorine Content in the Drinking Water. Stomatologiia (Mosk), 61: 75-77, 1982.
15. Bell, R.M., Klein, S.P., Bohannan, H.M., Graves, R.C. and Disney, J.A.: Results of Baseline Dental Exams in the National Preventive Dentistry Demonstration Program. R-2862-RWJ. Rand Corporation, Santa Monica, CA, 1982.
16. Jarvinen, S.: Epidemiologic Characteristics of Dental Caries: Relation of DMFS to DMFT. Community Dent. Oral Epidemiol., 11: 363-366, 1983.
17. Johnson, S. HHS News (U.S. Department of Health and Human Services: National Institutes of Health) June 21, 1988.
18. Kumar, J.V., Green, E.L., Wallace, W. and Carnahan, T.: Trends in Dental Fluorosis and Dental Caries Prevalences in Newburgh and Kingston, NY. Amer. J. Pub. Health, 79:565-569, 1989.
19. Rose, D. and Marier, J.R.: Environmental Fluoride, 1977. NRCC No. 16081. National Research Council of Canada, Ottawa, Ontario, 1977, pp. 75-83.
20. Featherstone, J.D.B. and Shields, C.P.: A Study of Fluoride Intake in New York State Residents. 0114Uc1288-1, Eastman Dental Center, Rochester, NY, 1988.
21. Segreto, A.S., Collins, E.M., Camann, D. and Smith, C.T.: A Current Study of Mottled Enamel in Texas. J. Amer. Dent. Assoc., 108:56-59, 1984.
22. Leveret, D.: Prevalence of Dental Fluorosis in Fluoridated and Nonfluoridated Communities - A Preliminary Investigation. J. Pub. Health Dent., 46:184-187, 1986.
23. Colquhoun, J.: Disfiguring Dental Fluorosis in Auckland, New Zealand. Fluoride, 17: 234-242, 1984.
24. Poulsen, S., Amaratunge, A. and Risager, J.: Changes in the Epidemiological Pattern of Dental Caries in a Danish Rural Community over a 10-year Period. Community Dent. Oral Epidemiol., 10:345-351, 1982.
25. Backman, B., Crossner, C-G. and Holm, A-K.: Reduction of Caries in 8-Year-Old Swedish Children between 1967 and 1979. Community Dent. Oral Epidemiol., 10:178-181, 1983.
26. Scrivener, C.: Unfavorable Report from Kansas Community Using Artificial Fluoridation of City Water Supply for Three-Year Period. J. Dent. Res., 30:465, 1951.
27. Galagan, D.J.: Climate and Controlled Fluoridation. J. Amer. Dent. Assoc., 47:159-170, 1953.
28. Schroeder, P.: Dental Health in Children in Rural Regions without School Clinics. J. Dent. Res., 50(Supplement Part 1):1231, 1971.
29. Yiamouyiannis, J.: Fluoride, the Aging Factor. Health Action Press, Delaware, Ohio, 1986m pp. 94-110.
References for Addendum
30. Brunelle, J.A.: Caries Attack in the Primary Dentition of U.S. Children. J. Dent. Res., 69(Special Issue):180 [Abstr. No. 575], 1990.
31. Brunelle, J.A. and Carlos, J.P.: Recent Trends in Dental Caries in U.S. Children and the Effect of Water Fluoridation. J. Dent. Res., 69(Special Issue):723-728, 1990.
32. Carlos, J.P.: Personal communication, 1989.
33. Disney, J.A., Bohannan, H.M., Klein, S.P., and Bell, R..M.: A Case Study in Contesting the Conventional Wisdom: School Based Mouthrinse Programs in the USA. Community Dent. Oral Epidemiol., 18:46-56, 1990.
Visit Fluoride: The International Journal for Fluoride Research on the web at www.fluoride-journal.com