

![]()
![]()
![]()
![]()
![]()
![]()
![]()
![]()
![]()
![]()
![]()
 .
.
Oral Health in America: Fluoridation, Tooth Loss and Oral Cancer
Oral Health America's recent report suggests that more teeth are lost and more oral cancers occur where there is MORE fluoridation in the USA.
April, 2002
Hardy Limeback BSc PhD DDS
Head, Preventive Dentistry
Faculty of Dentistry
University of Toronto
E-mail: hardy.limeback@utoronto.ca
Fluoridation supposedly reduces dental caries and, therefore, tooth loss. That's not what the recent Oral Health America report recently showed. In a closer examination of the grades given to various states with respect to their oral health status, it was clear that the states that had overall higher grades for fluoridating their communities, had lower grades for oral health indices.
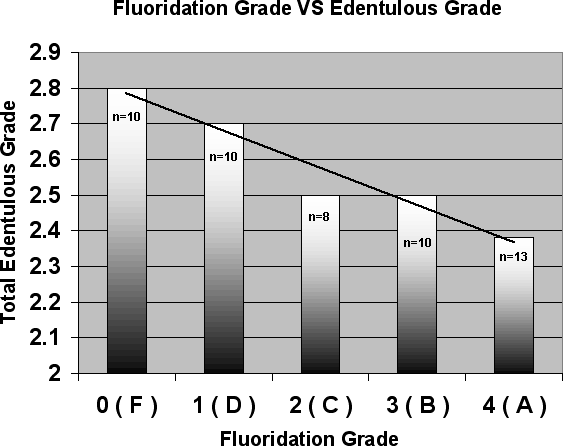
For example, the states that were awarded A's for having the highest percentage of their population on fluoridated water had the lowest grades for the percentage of people who still had their teeth. This means that fluoridation may not have protected people against tooth loss as intended. Rather, people were more likely to have missing teeth if they lived in the states where more than 50% of the population was fluoridated. Ironically, the states with the lowest percentage of communities with fluoridated water had the highest grades for oral health - in terms of missing teeth (e.g. more people kept their teeth if they lived in communities without fluoridation). This would suggest that fluoridation did not do what it was supposed to do. Here is how the data from the report was examined and how I have displayed the data to illustrate this point.
Analysis of Oral Health America data:
Using the data from the Oral Health America report "Filling the Gaps: Oral Health in America" (2001-2002):
1. The states were stratified according to their grade (grades F to A)
2. Using the grades from total edentulous elderly in the population, the average numerical scores for each group were calculated by converting the grades to scores and simply averaging them. The Report's own guideline or converting to numerical grades was used (i.e. grade A = 4, B = 3, C = 2, D = 1, F = 0)
3. The mean scores were plotted for each fluoridation grade in the two graphs below.
What the data suggests:
The grading system used in the Report was as follows:
Grade A (=4) - 0% to 14 % of people > 65 years
with no natural teeth
Grade B (=3) - 15% to 26% of people > 65 years with no natural teeth
Grade C (=2) - 27% to 38% of people > 65 years with no natural teeth
Grade D (=1) - 39% to 50% of people > 65 years with no natural teeth
Grade F (=0) - 50% t0 100% of people > 65 years with no natural teeth
Grade A (=4) - 90% to 100% of the population on
fluoridated water
Grade B (=3) - 80% to 89% of the population on fluoridated water
Grade C (=2) - 65% to 79% of the population on fluoridated water
Grade D (=1) - 50% to 64% of the population on fluoridated water
Grade F (=0) - < 50% of the population on fluoridated water
States that had higher percentages of the population on fluoridated water had lower oral health grades in terms of edentulous elderly (more elderly with fewer teeth).
Ironically, the edentulous grade DROPPED from nearly a B to nearly a C as the percentage of the population on fluoridated water INCREASED from <50% to about 100%. In real numbers this means that the edentulous rates CLIMBED from a mean of about 20% to about 35% when fluoridation was doubled, nearly a two fold increase in the edentulism rates in people older than 65 years of age. This has huge implications for the costs of dental care in fluoridated areas, especially in these days of increasing costs of tooth replacement (e.g. dental implants).
Possible explanations for the results.
Fluoridation and tooth loss: The chemical used for the fluoridation of drinking water in more than 90% of the major cities in the USA is hydrofluosilicic acid, or H2SiF6. Not only does this industrial grade chemical (recovered in crude form from wet scrubbers during the production of phosphate fertilizer) contain lead as a contaminant but its use instead of sodium fluoride (NaF) has been found to increase serum lead levels (Masters and Coplan, 1999; Masters et al, 2000). An increase in serum lead levels increases lead levels in teeth and this increases the risk for caries (Moss et al, 1999). Another possible explanation is that fluoridated water contributes to periodontal disease through a mechanism that has not yet been examined carefully.
The Oral Health America report – fluoridation and oral cancer.
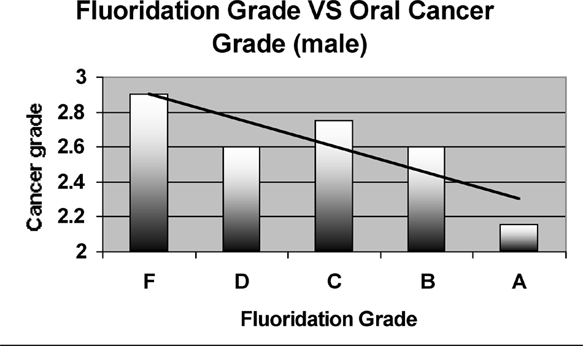
A similar analysis was carried out for grades assigned to the states with respect to the incidence of oral cancers. The diagram shows the results for males only.
States that had higher percentages of the population on fluoridated water had lower oral health grades in terms of oral cancer deaths in men (which means more men died of oral and throat cancers in the states where more communities were fluoridated).
What the numbers mean: The oral cancer mortality grading scale for men used in the Report was as follows:
Grade A (=4) - 0 to 2.5 deaths per 100,000 people
Grade B (=3) - 2.6 to 4.0 deaths per 100,000 people
Grade C (=2) - 4.1 to 5.5 deaths per 100,000 people
Grade D (=1) - 5.6 to 7.0 deaths per 100,000 people
Grade F (=0) - + 7.0 deaths per 100,000 people
The averages calculated from the Report show that states that had nearly their entire populations on fluoridated water (grade A) had about 2.6 to 4.0 (average of 3.3) deaths per 100,000 from mouth and throat cancers. The states with less than 50% of their population on fluoridated water (grade F) had mouth and throat cancer rates of only 0 to 2.5 (average of 1.25) per 100,000.
One can conclude from this that doubling the population exposure to fluoridated water from 50% to nearly 100% is associated with an INCREASE in the mortality rate from mouth and throat cancer by more than double (about 2.6 times). With more than 150,000,000 people in Canada and the US on fluoridated water, these estimates of increasing risk for mouth and throat cancers suggest that about 3000 EXTRA mouth and throat cancer deaths occur in the US and Canada from the exposure to fluoridated water...
Limitations of the data: It is assumed that this data is not corrected for differences in total populations, or adjusted for confounding factors such as age, gender, periodontal disease prevalence or other important confounding factors.
Possible explanations for the results.
Fluoridation and oral cancers: Not only is the fluoride ion itself genotoxic (Mihashi and Tsutsui, 1996), but arsenic, when found in the industrial grade fluorosilicates, contaminates drinking water with approximately 0.43 parts per billion (ppb) arsenic (range = 0.0 to 1.66 ppb). According to data from the National Academy of Sciences (see chart 1 below), this level of arsenic increases the risk of cancer by approximately one in 10,000. The arsenic content of the fluorosilicates could therefore be a potential risk factor for cancer; although it bears pointing out that arsenic exposure has not been specifically linked with oral cancer.
Suggestions for future research: The issue of fluoridation safety is far from being resolved, especially when untested industrial grade fluorosilicates are used to fluoridate the drinking water. Carefully conducted epidemiological studies should be undertaken to see if fluoridation actually protects against the loss of teeth into old age and whether fluoridated water is perfectly safe to drink and will not increase the risk of oral cancer.
References:
Masters RD, Coplan M. Water treatment with Silicofluorides and Lead Toxicity. Intern J of Environ Studies 1999 56:435-449.
Masters RD, Coplan MJ, Hone BT, Dykes JE. Association of silicofluoride treated water with elevated blood lead. Neurotoxicology. 2000 Dec;21(6):1091-100.
Mihashi M, Tsutsui T. Clastogenic activity of sodium fluoride to rat vertebral body-derived cells in culture. Mutat Res 1996 May;368(1):7-13
Moss ME, Lanphear BP, Auinger P. Association of dental caries and blood lead levels. JAMA. 1999 Jun 23-30;281(24):2294-8.
Chart 1: Lifetime Risks
of Dying of Cancer from Arsenic in Tap Water
Based upon the National Academy of Sciences' 1999 Risk Estimates*
From the Natural Resource Defense Council's February 2000 Report "Arsenic & Old Laws"
| Arsenic
Level in Tap Water (in parts per billion, or ppb) |
Approximate
Total Cancer Risk (assuming 2 liters consumed/day) |
| 0.5 ppb | 1
in 10,000 (highest cancer risk EPA usually allows in tap water) |
| 1 ppb | 1 in 5,000 |
| 3 ppb | 1 in 1,667 |
| 4 ppb | 1 in 1,250 |
| 5 ppb | 1 in 1,000 |
| 10 ppb | 1 in 500 |
| 20 ppb | 1 in 250 |
| 25 ppb | 1 in 200 |
| 50 ppb | 1 in 100 |
| *See note 3 at http://www.nrdc.org/water/drinking/arsenic/chap3.asp for details on how the NRDC calculated total cancer risk based on an extrapolation of NAS's risk estimates, which assumed a linear dose-response and no threshold. | |
www.fluoridealert.org